Imagine you’re working on something important, or your industrial equipment is operating at a critical moment, and suddenly, the screen turns blue, displaying a bunch of incomprehensible text, and then the system crashes! This is the dreaded “Blue Screen of Death” (BSOD). It’s frustrating and can potentially cause significant losses.
But for Advantech engineers, a blue screen is not just a problem; it’s a valuable “clue”! Like an airplane’s black box, the system’s state at the moment of collapse is recorded. This record is what we commonly call a “Memory Dump” file. By analyzing this file, engineers can act like detectives to uncover the real reason behind the system crash.
Why is a “Memory Dump” Needed?
Modern computer systems are incredibly complex. Software, hardware, and drivers interact with each other, and an error in any single link can lead to instability or even a crash. When a system crashes, the error message on the screen is often just the tip of the iceberg and doesn’t provide enough information to diagnose the problem.
A memory dump file is like a snapshot taken just before the system “dies”. It contains everything in memory at that moment, including running programs, the state of loaded drivers, and more. With this detailed “现场报告” (on-site report), engineers can use professional tools for in-depth analysis to precisely pinpoint which piece of code, which driver, or which hardware component caused the issue. This is crucial for improving product stability, finding potential bugs, and even optimizing system performance.
Advantech Engineers’ “Detective Toolbox”: Manually Triggering a Memory Dump
In certain specific R&D or testing scenarios, engineers might need to manually trigger a system crash for a suspected condition to obtain a memory dump, allowing for analysis in a controlled environment. Sounds a bit unbelievable? Don’t worry, this is a standard system diagnostic technique. Here are the steps Advantech engineers follow for this “detective work”:
-
Set up the “Automatic Recorder”: Ensure the system generates a complete crash report First, we need to tell the system to generate a detailed memory dump file when a critical error occurs.
- Open “Control Panel” -> “System and Security” -> “System” -> “Advanced system settings”.
- Under the “Advanced” tab, find “Startup and Recovery”, and click “Settings”.
- In the “System failure” section, confirm that “Complete memory dump” is selected in the “Write debugging information” dropdown menu.
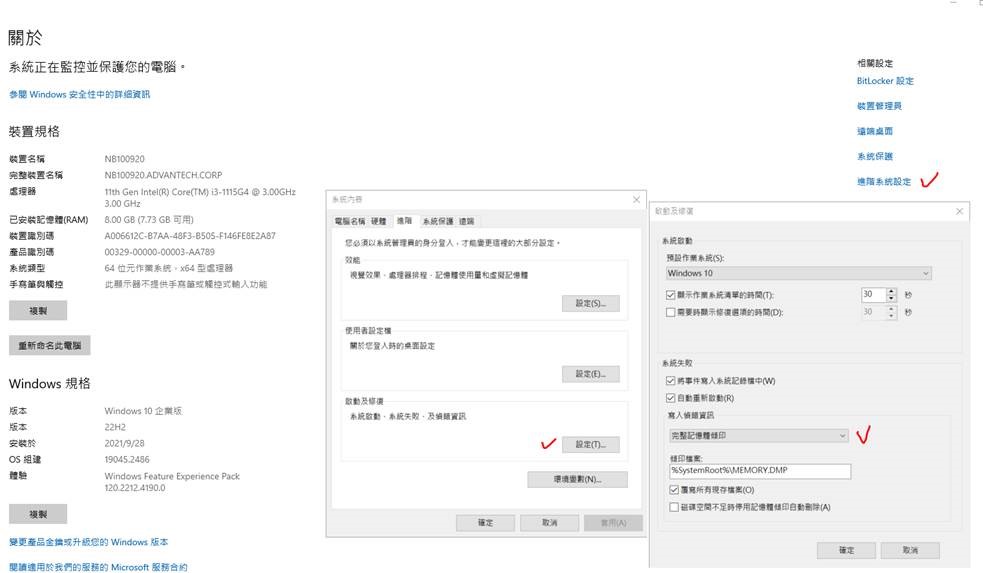
- Click “OK” to save the settings.
-
Open the “Secret Trigger Switch”: Enable keyboard shortcut to trigger a crash By default, Windows systems do not allow arbitrary crash triggering, but we can enable a special keyboard combination by modifying the system Registry.
- Open “Registry Editor”. You can press
Windows key + R, typeregedit, and press Enter. - Navigate to the following path:
HKEY_LOCAL_MACHINE\SYSTEM\CurrentControlSet\Services\kbdhid\Parameters - In this path, create a new DWORD (32-bit) Value and name it
CrashOnCtrlScroll. - Change the value of
CrashOnCtrlScrollfrom0to1.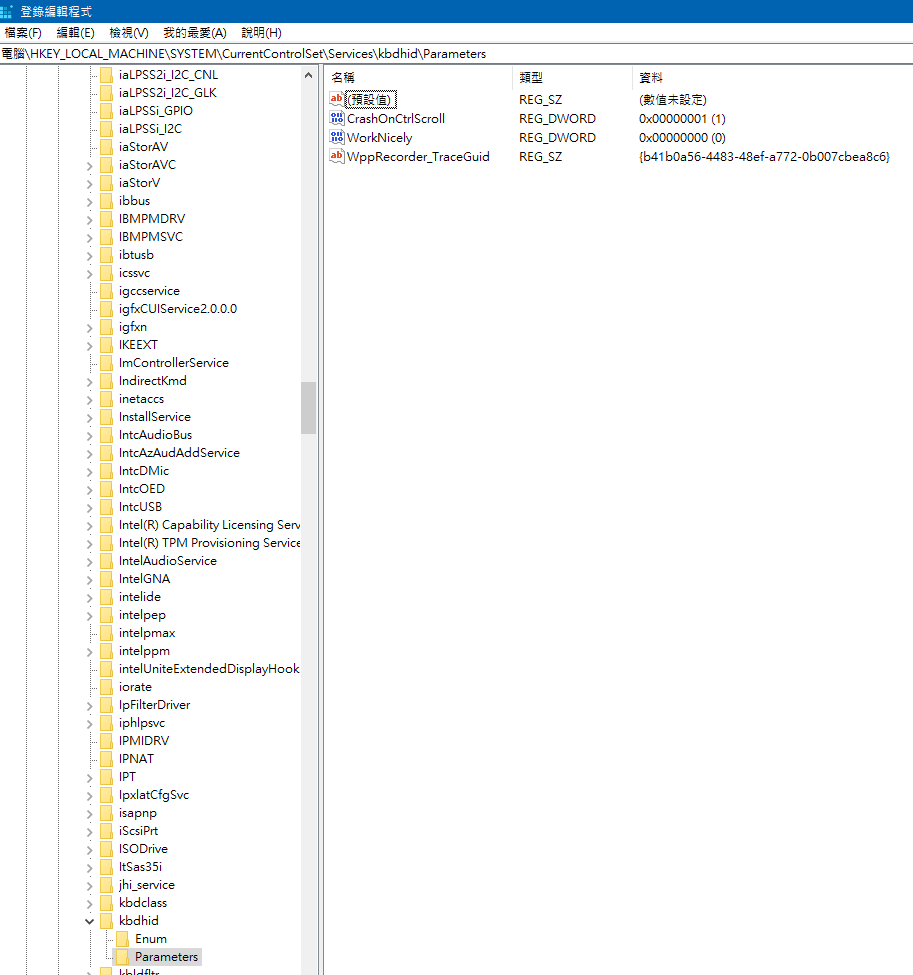
- After making the changes, close the Registry Editor and restart the computer for the settings to take effect.
- Open “Registry Editor”. You can press
-
“Trigger the Event”: Manually make the system “Blue Screen” Now, the system is ready to receive the command to manually trigger a crash.
- While the system is running normally, hold down the
Ctrlkey on the right side of the keyboard. - Then, quickly press the
Scroll Lockkey twice. - Upon detecting this special key combination, the system will immediately trigger a blue screen crash.
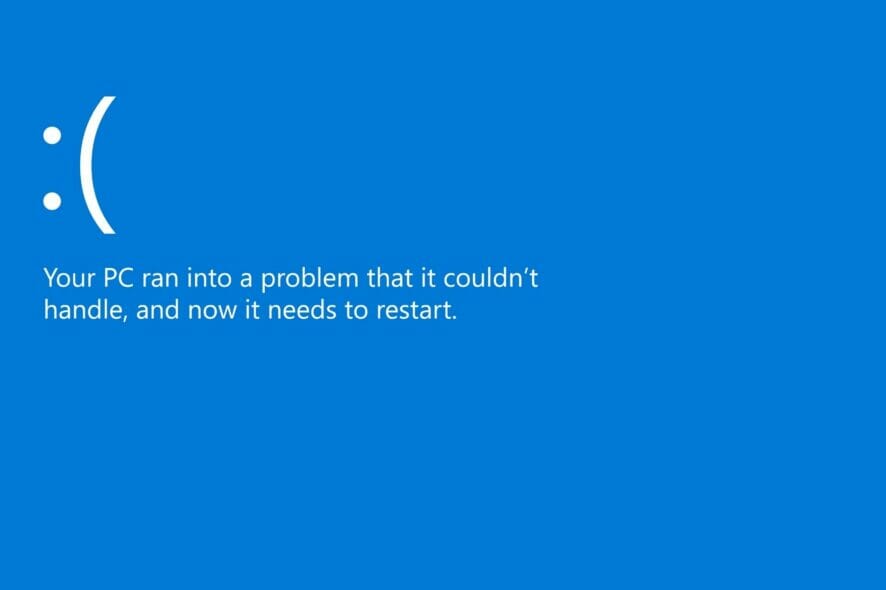
- The system will display the blue screen and begin collecting memory information, writing it to the dump file. This process may take some time, please wait patiently for the system to complete.
- While the system is running normally, hold down the
-
Collect the “On-site Evidence”: Find the memory dump file After the system finishes writing the memory dump, it will automatically restart (if automatic restart is configured).
- After the system restarts and enters Windows, you can find the memory dump file that was just generated.
- Typically, the complete memory dump file is stored in the
C:\Windows\directory and is namedMemory.DMP.
What is this “Report” Used For? How Does Advantech Benefit from It?
Once the Memory.DMP file is obtained, Advantech engineers use professional debugging tools (such as WinDbg) to load and analyze the file. They examine the Call Stack at the time of the crash, memory state, thread information, and more, peeling back the layers to find the root cause of the crash.
This in-depth analysis capability is key to Advantech ensuring product stability and reliability. By understanding the root cause of crashes, we can:
- Precisely Fix Bugs: Quickly locate errors in software or drivers and release updates to resolve issues.
- Optimize Hardware Design: Identify instability factors in certain hardware under specific conditions and improve hardware design.
- Enhance System Compatibility: Find potential conflicts between different software and hardware combinations and provide more stable integrated solutions.
- Accelerate Customer Problem Resolution: When customers encounter system issues, providing a memory dump file allows our engineers to diagnose and provide solutions faster, significantly reducing customer downtime.
This technique of manually triggering and analyzing memory dumps is just one of the many R&D tasks Advantech engineers quietly perform behind the scenes. It demonstrates our rigorous attitude towards product quality and our ability to solve problems by delving deep into the system’s core.
Conclusion and Outlook
Extracting valuable diagnostic information from seemingly terrifying blue screen crashes is an important method Advantech engineers use to ensure the high stability and reliability of the industrial computers and solutions we provide to our customers. This is not just about fixing errors; it’s about preventing future problems through continuous testing, analysis, and improvement.
Advantech is always committed to technological innovation and R&D investment. We deeply understand that in critical application areas, system stability is one of the values most important to our customers. In the future, we will continue to explore more advanced system diagnostic techniques, combining AI and big data analysis to further enhance our ability to predict and solve system problems, building a more robust and reliable foundation for the Industrial IoT for our customers.
Next time you see a blue screen, perhaps you can think differently: behind it, Advantech engineers are working hard to make future systems more stable!